How The VIX Provides Insight Into The Market's Direction
Recent market volatility (remember it's important to stay calm during market crashes) might have you wondering about ways to predict future market downturns. From losing money through sell-offs to the general anxiety of bad market days, having a way to more accurately predict when and/or if bad times are coming could be beneficial for investors and consumers alike. This is where the VIX comes in. Formerly known as the Chicago Board Options Exchange's Volatility Index, the VIX is a measurement tool that represents upcoming market expectations for price changes in real time. The index specifically looks at near-term options of the S&P 500 index and generates 30-day volatility projections.
For anyone unfamiliar with the term, volatility in stocks generally means how fast prices change. This can be used to gauge overall market sentiment, which can also be used as Wall Street's "fear gauge" or the level of fear among investors and market participants. Increased fear can lead to an increase in volatility, so the two measurements often go hand-in-hand. Similarly, the VIX generally rises (meaning there's more volatility/fear) when stocks fall, and declines (meaning there's less fear) when stocks rise. However, with that in mind, it's important to realize that, given the popularity of the VIX, it can be increasingly difficult to separate which comes first. That is, does the S&P 500 fall because the VIX rises, or vice versa? While it might not always be the easiest to determine which index is influencing the other, the VIX still serves as an important tool for potentially predicting upheaval.
Using the VIX index
As fear on Wall Street spikes as a result of some concerning economic markers (such as the rise in unemployment), volatility is sure to become a more regular experience. This can make using the VIX index more useful than ever. At its most basic, the VIX catalogs how sizable the price swings are within the S&P 500.
This means the more dramatic the price swings, the higher the level of volatility, and while this sounds simple enough, volatility can be tricky to measure. To start, there are two methods. The first relies on historical data and statistical calculations based on previous price data, while the second deduces the value implied from options prices (options prices are based on the probability of price movement for the specific stock or security in question). The VIX uses the second approach.
In addition to measuring volatility in the market, some traders also trade VIX futures, options, and ETFs in order to essentially bet on volatility changes that might occur. Some traders even use this as a way to diversify their portfolio, essentially profiting off of high-turmoil market periods (similar to how the wealthy use high interest and high inflation to their advantage). Yet, it's worth mentioning that the VIX has a direct impact on option prices and premiums, meaning that the index itself could manipulate financial swings. A higher VIX means higher options pricing while a lower one means lower options pricing.
Understand VIX numbers
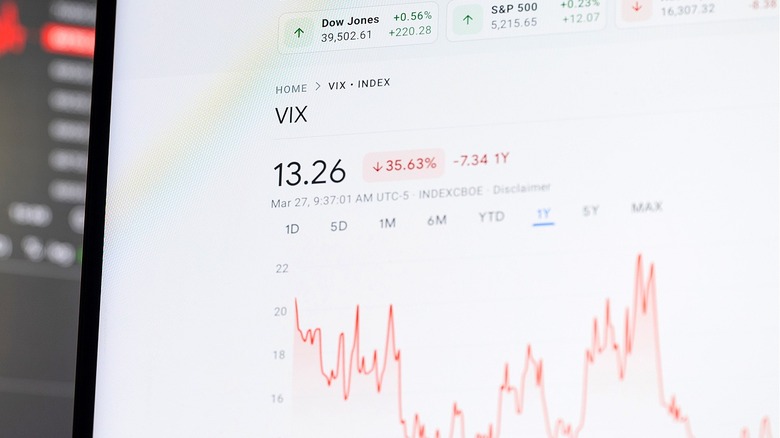
While the VIX's daily results can have a significant impact on the stock market, understanding its results can be key. The VIX essentially produces a single number to represent the real-time general sentiment of the S&P 500, using this particular index as a model or proxy for the market as a whole. Per VIX historical data, the long-run average of the VIX has been about 21. While the single number the VIX produces can be impactful, understanding what exactly it indicates can better help you use the VIX during your investing strategy.
VIX values below 15 are considered to be signs of an optimistic (and therefore more stress-free) market environment with low volatility. Values over 15 but less than 25, meanwhile, can signal a certain amount of volatility, but nothing that would be considered extreme or particularly stressful yet (this range is where the VIX's long-run average sits). Vix values of 25 to 30 can signal trouble, marking the increase in both turbulence and general market volatility, while values over 30 are linked to high volatility and extreme investor fear.
Values over 30 also serve as an indicator that extreme swings are imminent within the market. During the August 5, 2024, market crash, the VIX closed at 38.57, highlighting widespread fears of another U.S. economic recession (due to several red flag recession warning signs). It's worth noting that the highest the VIX has ever reached was 82.69 on March 16, 2020 (the day after many states began implementing shutdowns due to the onset of the COVID-19 pandemic).